
Report date: 2026-10-23 · Sources checked: October 24, 2026 (Korea time). Prices, balances and product terms refer to the cited reporting cutoff.
US spot Bitcoin ETFs ended a three-session inflow streak. Cointelegraph reported on October 23 that the previous session produced $635 million in net withdrawals, taking October’s balance to $175 million in net outflows.
An ETF trades on an exchange like a share. Flows into spot Bitcoin products show one route through which brokerage-account money enters or leaves Bitcoin exposure; they do not capture all trading across the cryptocurrency market.
On this page
Net flows are different from trading turnover
The $635 million figure is not the total value of ETF shares changing hands on exchanges. Net flow measures the difference between money entering and leaving. Heavy trading in existing shares does not establish that the fund’s asset base expanded by the same amount.
The SEC’s ETF bulletin separates exchange trading from the creation and redemption of fund shares. Bitcoin products have their own terms, but distinguishing secondary-market turnover from fund flows remains essential when reading the headline.
As an illustration, $2 billion of shares could trade during a session while the fund group recorded $100 million of net outflows. The first number describes activity and the second a net change. Adding them and calling the result $2.1 billion withdrawn would combine incompatible measures.
The time window changes the picture
At the reporting cutoff, the weekly total was still a positive $443 million. A negative day, positive week and negative month can coexist. Mixing those windows can turn a limited observation into an exaggerated claim that institutional money has universally left.
These figures follow US trading sessions. When comparing them with Bitcoin moves observed in Korea, align the session and reporting cutoff first. Check subsequent revisions as well.
Reconstructing the preceding totals
Assuming consistent cutoffs and no revisions, the reported figures imply that October had approximately $460 million of net inflows before this session. Subtracting $635 million produces the reported negative $175 million. The earlier totals below are arithmetic reconstructions, not additional observations from a data provider.
| Window | After October 22 | Total excluding that session, calculated |
|---|---|---|
| Reporting week | +$443 million | +$1.078 billion |
| October | −$175 million | +$460 million |
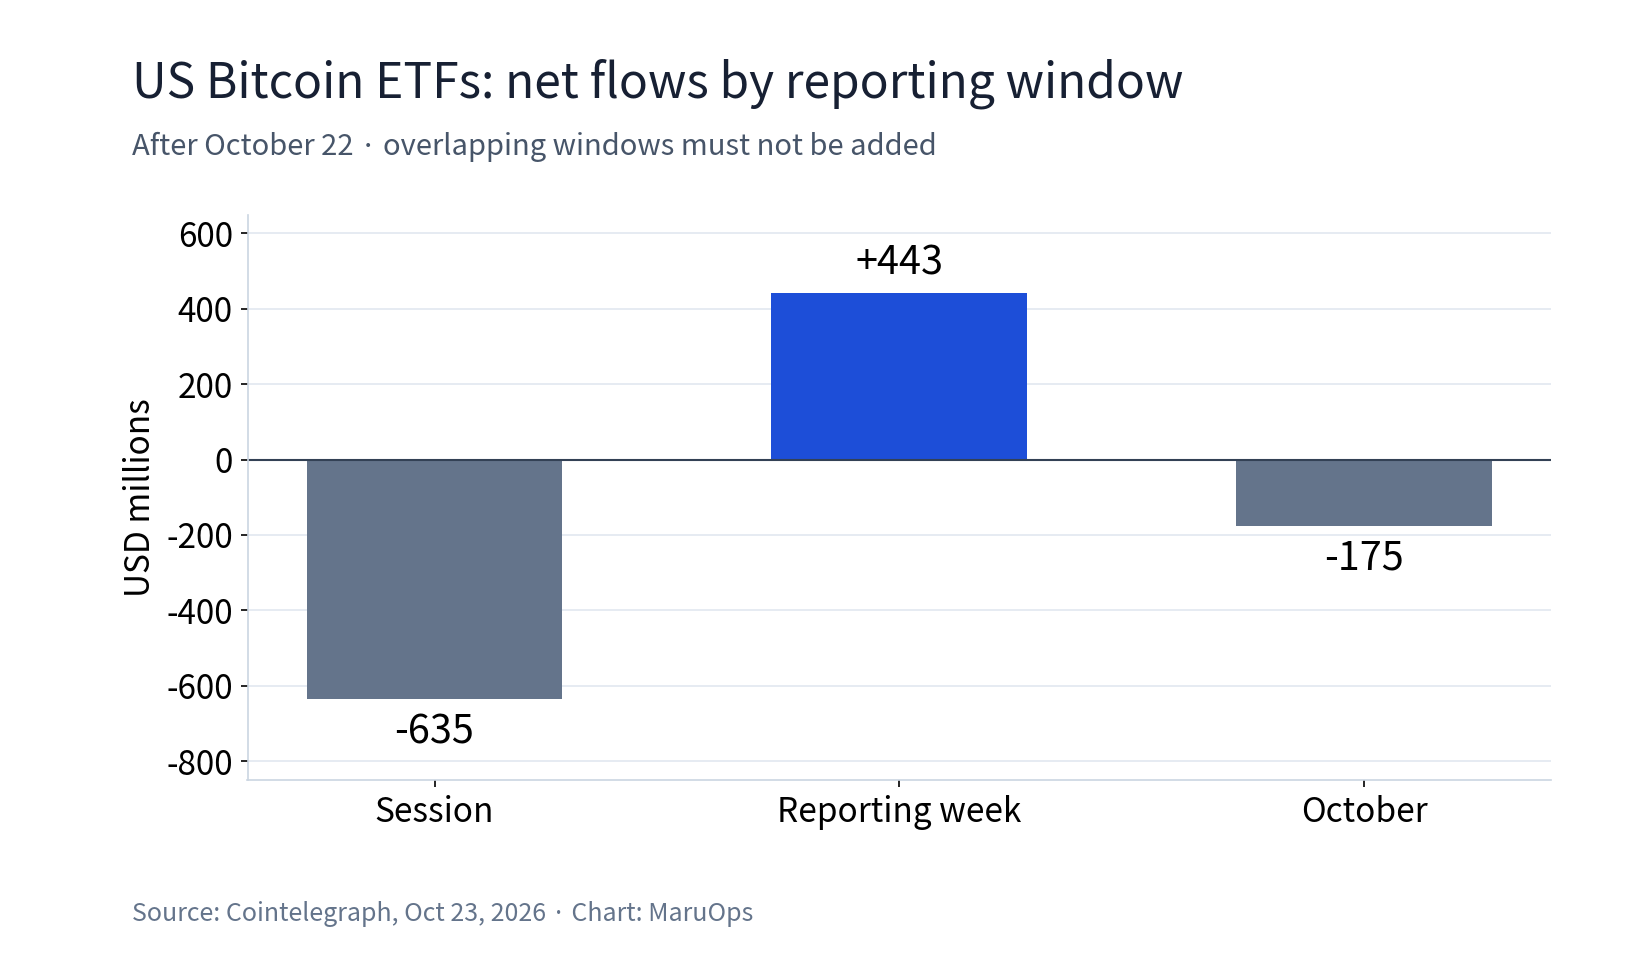
Different starting points explain why the same withdrawal leaves one window positive and another negative. Positive weekly flows and negative monthly flows can both be accurate. These aggregates also do not identify every investor behind the money, so they should not be relabelled as a precise measure of institutional purchases.
What to inspect in the next update
Look beyond one daily total to the cumulative flow over several sessions and the breakdown by fund. Redemptions concentrated in one product have a different meaning from withdrawals across the group.
Outflows alone cannot establish that the next session will bring a price decline. Money may be reacting to an earlier move, which makes the sequence of prices and flows worth examining together.
Absolute flows also need a denominator. A hypothetical $100 million withdrawal equals 1% of a $10 billion fund but 10% of a $1 billion fund. Those are illustrations, not calculated ratios for the actual funds in this report.
Flows can also offset across products. If one fund loses $500 million and another gains $400 million, the group’s net outflow is $100 million. The net alone conceals the distribution, while counting every withdrawal as money leaving the market ignores the offsetting inflow.
That is why fund-level figures, aggregate net flows and cumulative totals belong together. The size of a movement is also different from its motive. Explanations involving fees or portfolio adjustments require evidence from investors or managers, rather than inference from a single total.
Asset values add another moving part
A fund can hold the same number of bitcoins and still report fewer dollars of assets when Bitcoin falls. Conversely, appreciation can offset the effect of withdrawals. A change in assets under management therefore cannot simply be relabelled as an equal amount of redemptions.
For subsequent updates, keep the trading date, fund-level flows, cumulative total and data revision time together. Add a consistently timed Bitcoin price change alongside them. That makes it easier to judge whether a large session changed the cumulative picture or followed a move already underway. The confirmed change here is October’s net-flow balance turning negative, not the direction of the next session.
Sources and further material
SoSoValue US spot Bitcoin ETF data
SEC investor bulletin: ETF trading, creation and redemption
Related reading
Do Bitcoin ETF flows lead prices? DWF Labs studies 694 sessions
BlackRock files for PBIT: what Bitcoin downside protection means