Report date: 2026-10-23 · Sources checked: October 24, 2026 (Korea time). Prices, balances and product terms refer to the cited reporting cutoff.
Bitcoin becoming less volatile than in earlier years does not mean it has reached the stability of major currencies or equity indexes. CoinDesk’s October 23 analysis compared 90-day realized volatility using the previous day’s readings.
Realized volatility measures the dispersion of observed returns. These figures are annualized; a 38% volatility reading does not mean Bitcoin gained 38%.
On this page
Volatility measures variation rather than direction
Return describes gains or losses; volatility describes how much returns fluctuate. Large advances and declines can alternate, leaving a small final return but substantial volatility. The distinction is necessary before calling an asset more stable.
The OIC’s technical reference describes volatility as the annualized standard deviation of day-to-day price changes. Standard deviation summarizes dispersion around an average. It is different from the worst single-day loss or maximum drawdown.
Realized volatility uses observed historical changes. Implied volatility is inferred from option prices. Two reports published on the same date can therefore answer different questions if one concerns delivered variation and the other variation priced into options.
Comparing a consistent window
| Asset | 90-day realized volatility, annualized |
|---|---|
| Bitcoin | About 38% |
| Nvidia | About 37% |
| Gold | About 23.5% |
| S&P 500 | About 11% |
| EUR/USD | About 4.6% |
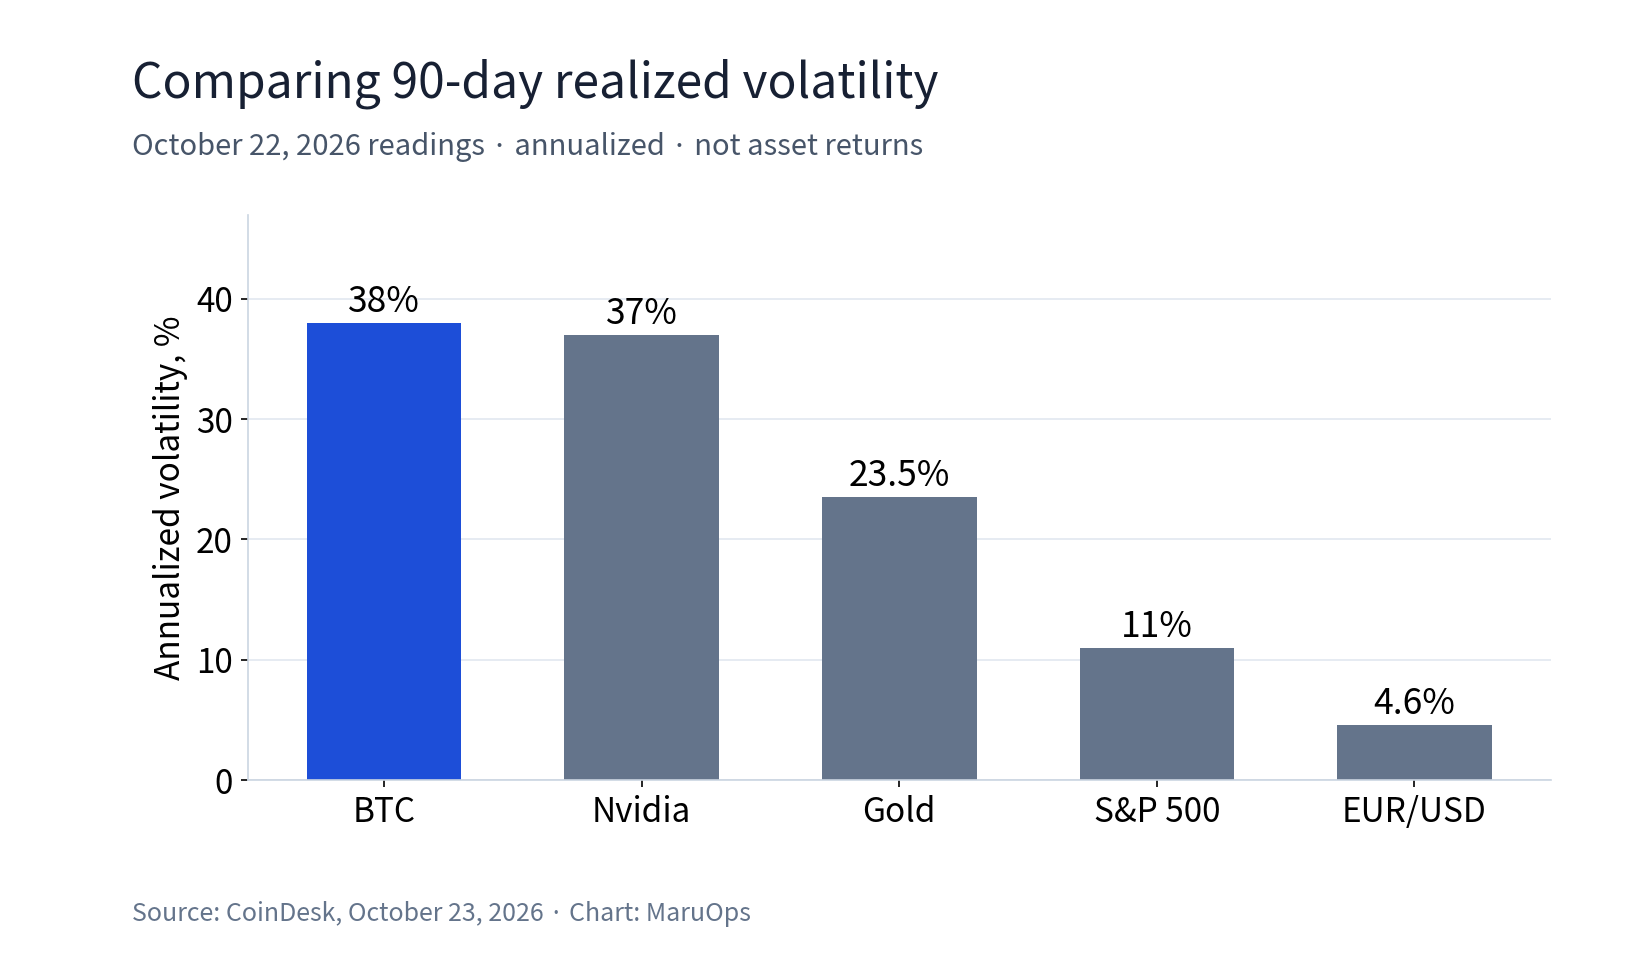
Bitcoin was close to Nvidia in this comparison and roughly eight times as volatile as EUR/USD. Similar volatility does not establish that two assets moved in the same direction; that would require a separate correlation analysis.
Translating 38% into an illustrative daily scale
A rough conversion from annualized to daily standard deviation divides by the square root of the assumed number of annual observations. Dividing 38% by the square root of 365 gives about 1.99%; using 252 gives about 2.39%. The different trading calendars of crypto and equities explain why conventions matter.
These are teaching examples, not a newly verified statement about the original data provider’s annualization method. Neither estimate guarantees that tomorrow’s return stays within that interval. Changing volatility and extreme price moves remain separate concerns.
Using the comparison table, 38% divided by the S&P 500’s 11% is approximately 3.45, and divided by gold’s 23.5% is approximately 1.62. With consistent definitions, the ratios compare variation; they do not directly determine loss probabilities or suitable portfolio weights.
Changing the window changes the result
Thirty-day and 90-day measures include different events. Closing-price choices, trading calendars and annualization conventions can also change the calculation. Align definitions before comparing figures from different providers.
Quieter historical prices do not set a ceiling on future losses. The comparison is useful for checking actual price variability before describing Bitcoin as a stable currency or a low-risk asset.
Lower percentage volatility can still mean substantial dollar variation for a larger position. An illustrative 2% move equals $20 on $1,000 and $2,000 on $100,000. Equal percentage exposure does not create equal financial consequences. This is not a recommendation of position size.
Portfolio volatility is also not the sum of its component readings. Weights and co-movement matter. Adding BTC’s 38% to gold’s 23.5% and calling the portfolio 61.5% would be incorrect. A proper calculation needs consistently measured returns.
Treatment of non-trading hours also affects cross-asset comparisons. Matching a continuously traded asset with a session-based equity is a methodological requirement. Missing conventions limit the precision that should be attached to relative-risk ratios.
Similar to Nvidia does not mean interchangeable
Two assets can have similar volatility while rising and falling on different days. Similar readings for BTC and Nvidia therefore do not establish the diversification benefit of holding them together. That assessment also needs return correlations and portfolio weights.
For later comparisons, align the 90-day window, observation date and annualization convention. Lower volatility than Bitcoin’s own past and higher volatility than other assets today can coexist. The supported observation concerns price variation over a defined interval, rather than proof that Bitcoin has become a stable currency or a limited-loss investment.
Sources and further material
Options Industry Council: technical information on volatility
Related reading
JPMorgan models 10% annual Bitcoin returns: reading the assumptions
Bitcoin put trading rises: hedging demand is not a certain price forecast